AWS Observability Accelerator from Amazon Web Services is a tool for monitoring, logging, alerting, and dashboards for Amazon Elastic Kubernetes Service (Amazon EKS) projects. This tool is for configuring and deploying purpose-built observability. And you can use AWS Observability Accelerator with Amazon Managed Service for Prometheus, AWS Distro for OpenTelemetry (ADOT), and Amazon Managed Grafana by running a single command to start monitoring applications. AWS Observability Accelerator for Kubernetes Telemetry provides a one-click solution that includes Prometheus and Grafana workspaces, OpenTelemetry collectors, and IAM roles. It also provides Prometheus recording rules and alerting rules to be integrated with Amazon Managed Service for Prometheus and Amazon Managed Grafana dashboards. Here we will go through an example of monitoring infrastructure within your Amazon EKS cluster.

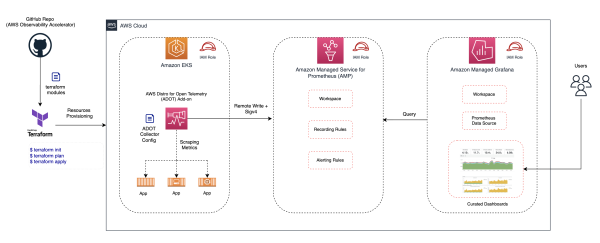
The architecture of the AWS Observability Accelerator
AWS Observability Accelerator for Comprehensive Kubernetes Telemetry simplifies the observability challenges by providing Amazon Managed Grafana dashboards, AWS Distro for OpenTelemetry collector to collect metrics, store them on Amazon Managed Service for Prometheus and configure alerts and recording rules. To solve the observability challenges of the existing environments, AWS Observability Accelerator collects metrics about the applications configured on the Amazon EKS clusters, monitors the health of the Kubernetes components, and monitors the infrastructure where applications are hosted. The example below demonstrates using AWS Observability Accelerator to set up infrastructure monitoring. Also, this example shows leveraging an existing Amazon EKS cluster and an Amazon Managed Grafana workspace.
Prerequisites
To use AWS Observability Accelerator, you must have an existing Amazon EKS cluster, an Amazon Managed Grafana workspace, and an existing Amazon Managed Service for Prometheus workspace. Or else this solution will create Amazon Managed Service for Prometheus workspace.
- AWS CLI version 2
- kubectl
- Terraform
- jq
- An AWS account
- Configure the credentials in AWS CLI
- An existing Amazon Managed Grafana workspace
Step 1: Clone the repository using the following command
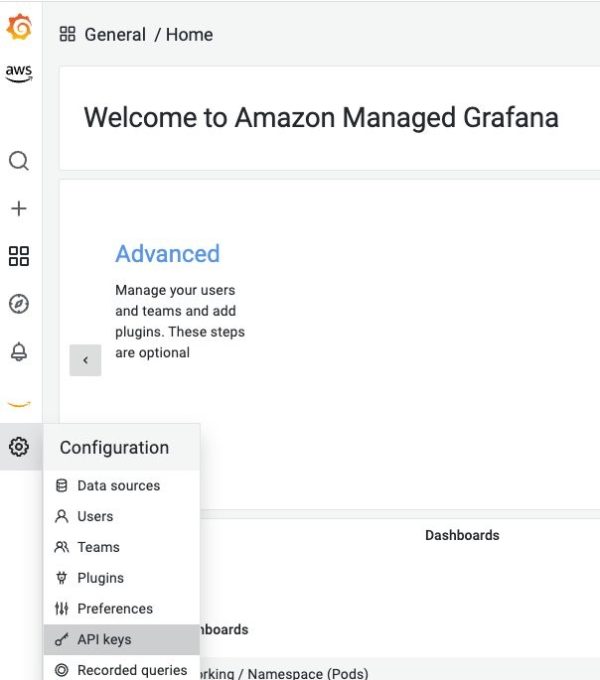
Step 2: Log in to an existing Amazon Managed Grafana workspace and create an API key.

Step 3: Initialize the Terraform using the command below.
Step 4: Configure the variable file to specify the existing Amazon EKS cluster and Amazon Managed Grafana workspace to deploy Terraform Module.
Step 5: Execute the command to evaluate the configuration files in a directory.
Step 6: Run the terraform plan command to create an execution plan with a possible preview of the Terraform infrastructure changes.
After deploying terraform, the Amazon Managed Service for Prometheus console will provide details of successfully created rules. And can explore Amazon Managed Grafana to find the dashboards that are created by the terraform module.
Step 7: In the Amazon EKS console, confirm the creation of the ADOT add-on using the following command.
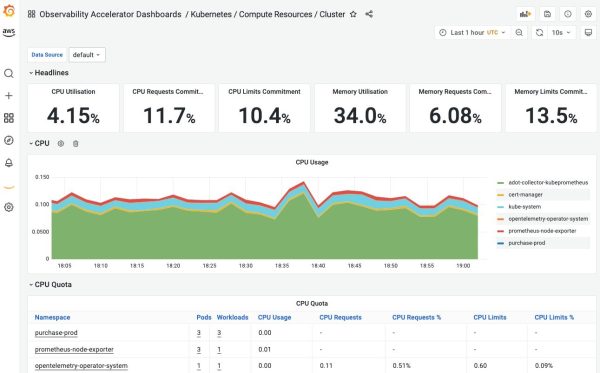
Step 8: To visualize the metrics on Amazon Managed Grafana, log in to Amazon Managed Grafana workspace, select Dashboards, and choose Browse. Next, select the “Observability Accelerator Dashboards“ folder. Here you can see the CPU, Memory utilizations at the Amazon EKS cluster level.

Also, you can explore the dashboard that shows the utilization by the worker nodes of the Amazon EKS cluster, the network utilization by namespace level configured on the Amazon EKS cluster, and the Kubelet information and the operations rate of the Kubelet.
Conclusion
AWS Observability Accelerator for Kubernetes Telemetry monitors specific application types deployed on Amazon EKS and configures EKS workloads with AWS-managed instances. Thus users can deploy AWS Distro for OpenTelemetry to collect metrics and store them in a secure and scalable fashion on Amazon Managed Service for Prometheus. And can use Amazon Managed Grafana to visualize the diverse set of metrics and help customers get a holistic view of their environment.
Consult Metclouds technologies to assist you with AWS Observability Accelerator for Comprehensive Kubernetes Telemetry


